
A Smarter Way To Manage Home Energy During Load-Shedding
- A final-year engineering project at Stellenbosch University examined how a home energy system can combine live inverter data, weather forecasts, and load-shedding schedules on one local dashboard. The result was a Raspberry Pi-based Home Energy Management System that monitors household energy flow, predicts demand, and adjusts battery charging and selected loads ahead of outages.
For many South African households with solar panels and batteries, the hard part isn’t installing the hardware. The harder part is deciding when to charge the battery, when to hold power back, and when to run heavy loads.
Aldrich Opperman’s final-year engineering project focused on that daily problem by building a Home Energy Management System (HEMS), which brings live data and household control into one local device.
Bringing Energy Data Into One Place
The system runs on a Raspberry Pi 4 and uses a 7-inch touchscreen as its main interface. On screen, the user can view household energy flow, weather forecasts, load-shedding schedules, and the status of connected smart switches. The report describes five main screens:
- An overview dashboard
- A weather screen
- An inverter screen
- A load-shedding screen
- A settings screen.
Together, they give the user one place to check what the home is doing and what may happen next. The screenshots in Appendix C show how the interface pulls these views into a single display with charts, status panels, and control toggles.
The HEMS gathers data from several sources. It pulls inverter data from the Sunsynk system, fetches weather data from Open-Meteo, and checks load-shedding information through the EskomSePush API. It can even communicate with Sonoff smart switches over the local Wi-Fi network to turn selected household loads on or off. In the project setup, those switches stand in for appliances such as a pool pump and lamps.


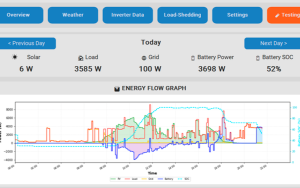
Fig 1: HEMS’s device front and back and software dashboard views.
From Monitoring to Control
A key part of the project lies in the jump from monitoring to control. The report sets out three operating modes. Normal mode clears prior programmed settings and leaves the system on standby. Blackout mode prepares the house for an outage by turning off non-essential loads and charging the battery as fast as the inverter settings permit. Automated mode handles day-to-day decision-making. In that mode, the controller checks battery state of charge, solar generation, household load, weather data, and load-shedding schedules, then decides how to prepare the system for the hours ahead.
That decision-making process includes two practical tasks. First, the HEMS plans battery charging ahead of scheduled outages. Second, it looks for periods when solar generation exceeds the home’s needs and switches selected loads on so that surplus solar power gets used inside the home. In the project demonstration, that logic controlled a pool-pump circuit through a Sonoff switch. The report’s control flowchart on page 25 shows how the system checks these conditions during each cycle and then commits any inverter changes as one settings transaction.
Using Prediction in a Practical Way
The project’s prediction layer uses a LightGBM regression model trained on historical load and weather data stored in a local SQLite database. Instead of treating household demand as a flat average, the model uses time-based features, weather inputs, weekend and holiday flags, lag values from earlier days, and rolling averages. In plain terms, it learns the household’s habits from historical data, then uses that pattern to estimate future demand during a scheduled outage window.
The same control cycle includes a solar estimate. The report uses the PVlib Python library with the home’s coordinates, sun position, cloud cover, and panel capacity to estimate likely PV output over the same period. The controller then combines predicted load and estimated solar generation to calculate how much battery charge the house may need before load-shedding starts. That turns the HEMS into a planning tool, not only a live monitor.
What the Testing Showed
The report gives the system a solid round of validation. It checked that the screens matched their live data sources, that the inverter data plotted correctly over time, and that screen switching stayed smooth. The inverter data pipeline polled for new values every 15 seconds and stored them in SQLite, allowing the system to display up to seven days of historical energy flow rather than only the current inverter state. On the energy flow graph, the report identifies grid usage, battery charging, battery discharge, the start of PV generation, and morning load spikes.
The machine learning model was tested on unseen data and recorded a validation RMSE of 412.43 W and a validation MAE of 218.83 W. The report states an average prediction accuracy of 79.85% across a 30-day simulated period. A separate charge-plan test over 15 simulated days recorded an average planning error of 6.05 kWh for a 10 kWh battery system.
Operation tests then checked that the controller carried those decisions through in practice. In Blackout mode, the system switched off the pool pump and prepared the battery for an outage. In Automated mode, it started charging at the planned time in one test case and turned on a demonstration load in another when solar production exceeded household demand.
That said, a project like this only works if it can stay up for long periods without freezing or leaking memory. The report spends useful time on that side of the job. The system uses background threads for data collection, then schedules interface updates on the main UI thread so the dashboard stays responsive. A separate resource manager tracks graph objects and clears them when screens change.
In testing, memory use settled at about 242 MB and ended a 48-hour run at 245 MB, which pointed to steady operation rather than a growing leak. Peer testing added one more layer by checking whether people with no prior knowledge could use the interface without breaking it.
Final Thoughts
What lifts the project above a basic dashboard is its mix of software, control logic, and local use. It doesn’t stop at showing graphs. It tries to make a home energy system act earlier, using the data already available to it. The report’s preliminary cost section puts the hardware at about R3,650 and sketches a possible payback period of roughly 10 months under a narrow pool-pump scenario. That figure depends on the stated assumptions, so it shouldn’t be read as a blanket savings claim. Even so, the project makes a clear case for a small, local controller that gives households a closer grip on battery use, solar timing, and outage preparation.
Related stories

Engineering and technology
From Radar Reflections to Images: Reconstructing Rotating Scenes With ISAR
Radar can measure how far away an object is and whether it’s moving, but creating a detailed image from reflected radar signals requires several additional...

Engineering and technology
Comparison of Radio Propagation Models for Receive-Level Anomalies at SKA
At the Square Kilometre Array site in South Africa's Northern Cape, reliable radio communication isn't optional. The teams operating the site depend on mobile...
Engineering and technology
Turning Target Impacts Into Instant Wireless Feedback
In long-distance precision shooting, confirming a target impact becomes harder as distance increases. Spotting scopes, cameras, and sound-based confirmation can...