

Comparison of Radio Propagation Models for Receive-Level Anomalies at SKA
- A final-year engineering project at Stellenbosch University compared two radio propagation models: Longley-Rice and ITU-R P.526 at the Square Kilometre Array (SKA) site in South Africa. Nikita van Rooi, supervised by Prof Riaan Wolhuter, used machine learning to identify the terrain features that cause signal prediction failures, finding ITU-R P.526 to be the more accurate and stable model.
At the Square Kilometre Array site in South Africa's Northern Cape, reliable radio communication isn't optional. The teams operating the site depend on mobile radio links to coordinate work across a remote landscape. But the models used to plan those links - tools that predict how well a signal will travel across terrain - don't always get it right. Van Rooi's final-year engineering project at Stellenbosch University asked a direct question: when these models fail, why do they fail, and can the specific terrain features behind those failures be identified?
Two Models, One Site
The project compared two widely used radio propagation models. Longley-Rice uses a recursive diffraction method called the Deygout approach, which calculates signal loss by accounting for multiple obstacles along a path. ITU-R P.526, by contrast, uses the Bullington method, which simplifies the terrain to a single equivalent obstacle. Both models are used in link planning — the process of predicting signal coverage before infrastructure is put in place, but neither was developed specifically for the unusual terrain of the SKA site.

Fig 1: Investigation Design
Van Rooi simulated 411 site links across five base stations at a frequency of 40 MHz, using real terrain data from the SKA site. Each prediction was then compared against measured field data to identify each mode’s shortcomings.
Measuring What "Wrong" Looks Like
Not every prediction error is equally significant. In radio link planning, a useful industry reference point is the fade margin, the built-in signal buffer that engineers add to account for variability. Using a ±10 dB threshold as an anomaly boundary, the project classified each link prediction into one of three categories: non-anomalous, pessimistic anomaly (the model predicted worse reception than was measured), or optimistic anomaly (the model predicted better reception than reality). Optimistic anomalies are particularly problematic in practice because they suggest a link will work when it may not.
This classification system gave the project a structured way to compare the two models and quantify their failure rates under identical conditions.
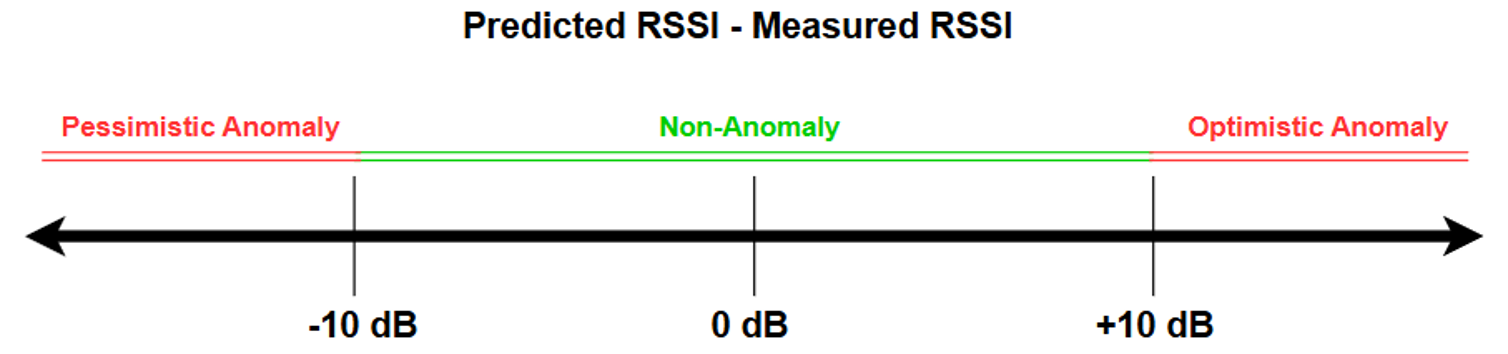
Fig 2: Anomaly Classification Threshold
Using Machine Learning to Find the Cause
Counting errors only tells part of the story. Van Rooi used machine learning to go a step further and identify which terrain features were most likely to trigger anomalies in each model. Three classifiers were tested: Random Forest, XGBoost, and an Ensemble model - with careful validation steps including an 80/20 train-test split, SMOTE oversampling applied only to training data to avoid data leakage, and five-fold cross-validation to confirm stability.
Statistical tests (Kruskal-Wallis and Mann-Whitney U) confirmed that the differences between anomalous and non-anomalous links were significant, not random. The best-performing classifiers achieved two to five times improvement over a random baseline, confirming that the identified terrain features genuinely predict model failure.
What the Data Showed
ITU-R P.526 outperformed Longley-Rice by a meaningful margin. It produced non-anomalous predictions for 78% of links, compared to 68% for Longley-Rice. When the two models were cross-classified (checking which links both agreed on), they aligned on 63% of cases, suggesting consistent underlying physics between the two approaches, but also a significant disagreement zone where one model succeeds and the other doesn't.
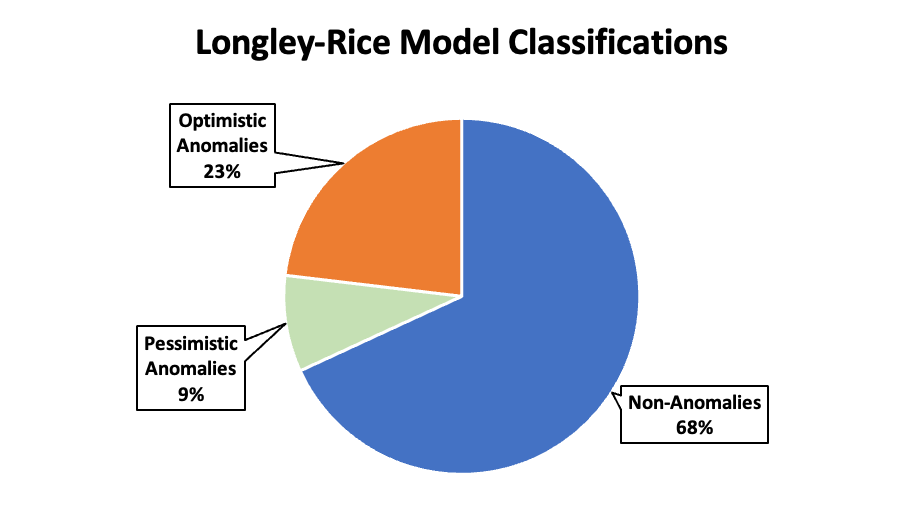
Fig 3 (a) Longley-Rice Performance
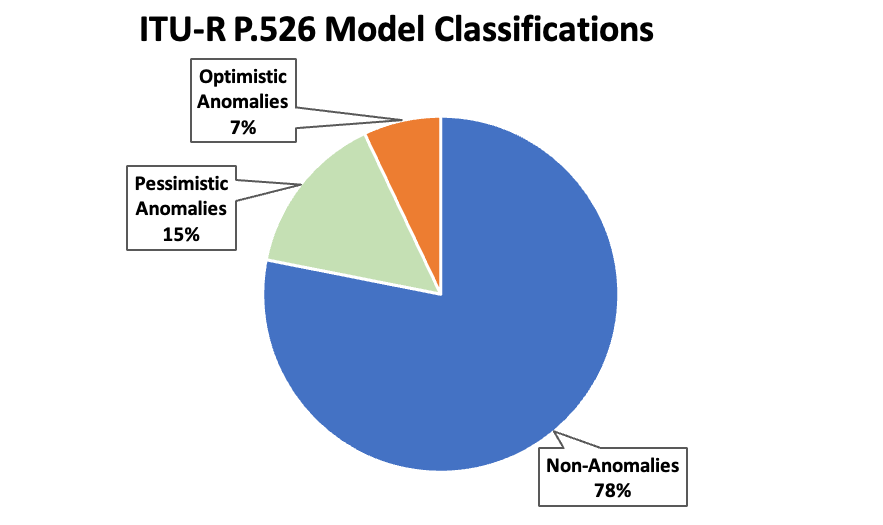
Fig 3 (b) ) ITU-R P.526 Performance
Machine learning identified the key terrain drivers for each model. For Longley-Rice, the top three features were clearance ratio, maximum obstacle height above the line-of-sight, and path length. For ITU-R P.526, the drivers were mean elevation, path length, and number of line-of-sight obstacles. These findings map directly onto how each model processes terrain internally. In Longley-Rice, the clearance ratio influences a weighting factor that shifts between knife-edge and rounded-earth diffraction - extreme values push the model towards inaccurate predictions in either direction. In ITU-R P.526, high mean elevation reduces effective antenna clearance, increasing diffraction loss and causing pessimistic predictions; low elevation does the reverse.
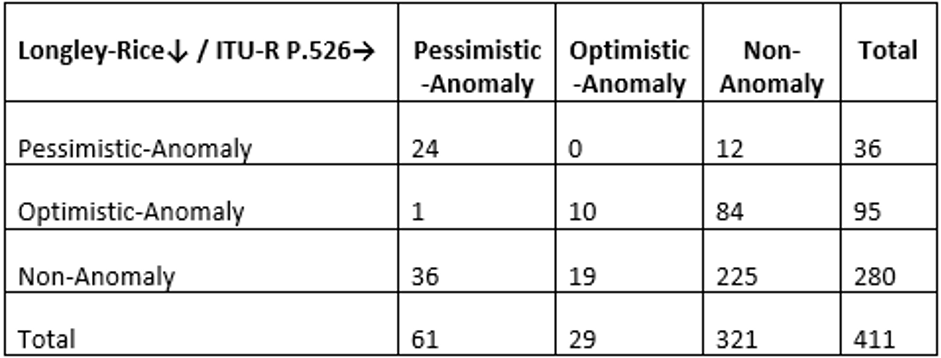
Fig 4: Cross-Classification Results
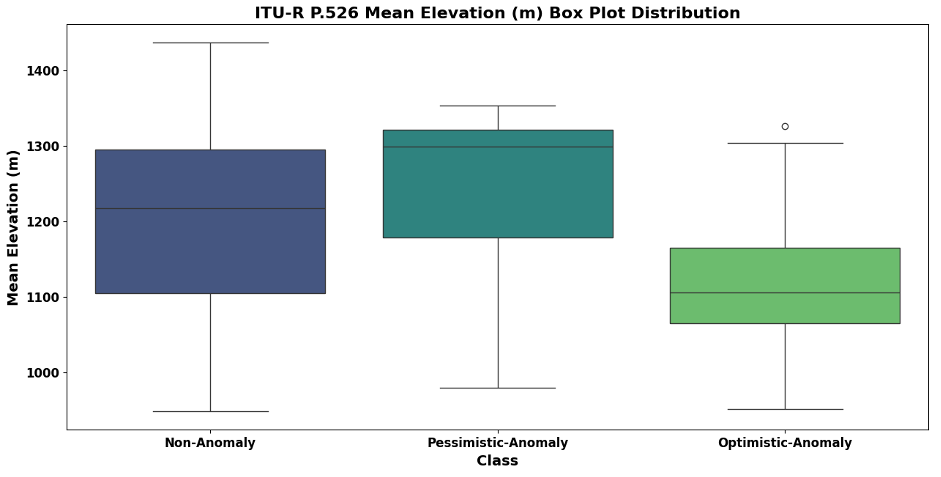
Fig 5: ITU-R P.526 Mean Elevation Box Plot Visualizations
Final Thoughts: Practical Guidance for SKA Engineers
The research translates into a clear set of design guidelines. ITU-R P.526 is the recommended primary model for the SKA site. Links with extreme clearance ratios, tall obstacles significantly above the line-of-sight, long paths, or extreme mean elevation should be flagged as high-risk and treated with additional field validation before infrastructure is committed. Minimising Fresnel zone blockage where possible, and avoiding tall obstacles above the line-of-sight, will reduce the likelihood of anomalous predictions in the first place.
For a site where link planning errors can translate into expensive redesigns, the project delivers something practical: a way to identify which planned links are most likely to be wrong, before those errors become problems.
Related stories
Engineering and technology
Turning Target Impacts Into Instant Wireless Feedback
In long-distance precision shooting, confirming a target impact becomes harder as distance increases. Spotting scopes, cameras, and sound-based confirmation can...

Engineering and technology
A Smarter Way To Manage Home Energy During Load-Shedding
For many South African households with solar panels and batteries, the hard part isn’t installing the hardware. The harder part is deciding when to charge the...

Engineering and technology
When Mobile Networks Fail, A Phone Can Still Reach Your Group
At a concert, sports event, or outdoor gathering, people often assume their phones will work when they need them. In practice, that can fall apart fast. If too...