

From Radar Reflections to Images: Reconstructing Rotating Scenes With ISAR
- A final-year mechatronic engineering project at Stellenbosch University developed a MATLAB algorithm that turns radar reflections from a rotating scene into a two-dimensional image. By combining circular measurements, signal processing, back projection, and minimum-entropy focusing, the system located single and multiple targets and achieved a measured resolution of 1.65 cm in both image directions.
Radar can measure how far away an object is and whether it’s moving, but creating a detailed image from reflected radar signals requires several additional processing steps. A final-year mechatronic engineering project by Satheesh Bissessur, supervised by Mr Lanche Grootboom, explored how those reflections can be turned into a clear, two-dimensional image of a scene.
The project focused on inverse synthetic aperture radar, or ISAR, imaging. Bissessur developed a MATLAB algorithm that processed radar data recorded while a platform carrying one or more targets completed a circular rotation. The final system successfully located the targets, reduced unwanted background signals, and produced a focused image with measurable spatial resolution.
How ISAR Creates an Image
A radar system transmits electromagnetic waves and records the signals reflected by objects in its field of view. The time taken for a signal to travel to an object and return provides information about distance. Changes in the signal’s frequency can provide information about motion.
Synthetic aperture radar, or SAR, creates detailed images by moving the radar past a stationary scene. ISAR reverses this arrangement. The radar remains in place while the target moves or rotates. The system combines measurements taken from several viewing angles, creating the effect of a much larger antenna.
That approach can improve image detail, although the reconstruction process remains sensitive to target motion, background noise, measurement errors, and the number of available viewing angles. Bissessur’s project addressed these factors through a sequence of signal-processing and image-reconstruction methods.
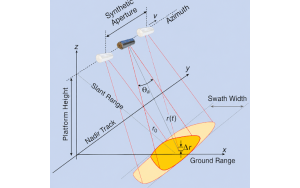
Figure 1: Illustration of the SAR imaging geometry
Recording The Circular Backscatter Data
The experimental setup used two horn antennas connected to a vector network analyser, or VNA, which measures how electrical signals change as they pass through or reflect from a system. One antenna transmitted signals, and the other received the reflected energy.
Reflective targets were placed on a rotating pedestal approximately 70 cm from the antennas. The pedestal completed a full 360-degree rotation in 1.8-degree increments, yielding measurements at 200 viewing angles. At each angle, the equipment recorded 566 frequency samples.
The first experiment used one target positioned about 20 cm from the centre of the pedestal. A second experiment used three targets in different positions. This allowed the final algorithm to be tested on both a simple scene and one containing several reflective objects.
Processing The Raw Radar Measurements
The recorded data couldn’t be converted directly into an image. The algorithm first removed measurements below 1 GHz because the antennas couldn’t provide dependable results at those frequencies.
It then applied background subtraction, which removed reflections recorded when no target was present. Windowing functions reduce side lobes, which are unwanted signal peaks that can blur or hide nearby targets. Zero-padding added extra zero values to the signal before processing, creating a more finely spaced output and improving the displayed distance resolution.
The system also aligned the range profiles from different angles. A range profile shows the strength of reflections at different distances from the radar. Without alignment, the strongest reflection can appear to move between distant positions as the pedestal rotates, producing a blurred image.
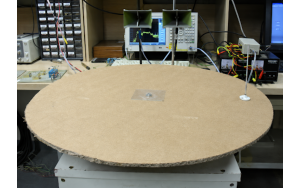
Figure 2: Picture of the first experiment setup taken in front of the antennas
Changing Course After the First Algorithm
Bissessur initially implemented a Range-Doppler algorithm, a widely used method that combines distance and motion information to create a two-dimensional radar image.
Although the first algorithm placed the target correctly in the distance direction, it didn’t reproduce the target’s correct position across the image. The method didn’t suit the circular turntable measurements closely enough.
The project then shifted to a back projection algorithm. This method created a 256 by 256 pixel grid covering an area from minus 30 cm to 30 cm in both directions. For every viewing angle, the algorithm calculated the distance between the antennas and each point on the grid. It then added the corresponding reflected signal energy to that point.
Because the recorded range values were discrete, they didn’t always match the calculated distance to a pixel. Linear interpolation filled the gaps between measurements so that every grid point could receive an estimated signal value.
Finding The Best-Focused Image
The first back-projected image remained blurred because the measured distance between the antennas and the centre of the scene wasn’t accurate enough for image reconstruction. Even a small geometric error caused reflected energy to spread across several pixels.
To correct this, the project used a minimum-entropy method. Image entropy measures how widely signal energy is distributed. A focused radar image concentrates most of its energy around a small number of target pixels, giving it a lower entropy value.
The algorithm tested possible antenna-to-scene distances between 60 cm and 80 cm and selected the value that produced the lowest image entropy. Testing 10 possible values produced an estimated distance of 73.33 cm and completed in under five seconds. Testing 50 values produced a slightly sharper result at 74.29 cm, although the process took about four times longer. This comparison highlighted the balance between image focus and computation time.
What The Results Showed
The final image placed the single target at coordinates of approximately minus 22 cm and 0 cm. The actual target was positioned at minus 20 cm and 0 cm, leaving a cross-range offset of about 2 cm. The distance from the antennas was reconstructed correctly.
The measured resolution was 1.65 cm in both the distance and cross-range directions. The image also showed a strong target peak and low signal levels across the rest of the scene, indicating that background subtraction and windowing had reduced noise and unwanted side lobes.
The amount of circular data affected image quality. Using half of the 200 viewing angles still produced a recognisable and reasonably focused image. Using only a quarter produced a poorly focused result because the smaller angular span reduced cross-range resolution.
When the same algorithm processed the three-target dataset, it produced three clear peaks in the expected areas. The distance coordinates were accurate, although the targets showed a similar cross-range offset to the single-target result.
Final Thoughts
The project met its main goal of developing an ISAR reconstruction algorithm that converts recorded circular backscatter data into a focused image. It also showed why reconstruction methods need to match the geometry of the measurement setup. When the first approach proved unsuitable, the project moved to back projection and introduced an image-based method for correcting measurement uncertainty.
Future work could correct the remaining cross-range offset and test the algorithm on more complex targets with different shapes and sizes. The existing MATLAB system provides a practical foundation for further work in radar imaging, object recognition, and target analysis.
Related stories
Engineering and technology
Comparison of Radio Propagation Models for Receive-Level Anomalies at SKA
At the Square Kilometre Array site in South Africa's Northern Cape, reliable radio communication isn't optional. The teams operating the site depend on mobile...
Engineering and technology
Turning Target Impacts Into Instant Wireless Feedback
In long-distance precision shooting, confirming a target impact becomes harder as distance increases. Spotting scopes, cameras, and sound-based confirmation can...

Engineering and technology
A Smarter Way To Manage Home Energy During Load-Shedding
For many South African households with solar panels and batteries, the hard part isn’t installing the hardware. The harder part is deciding when to charge the...